Background
BNY, one of the world's leading investment management firms, sought to empower its distribution teams and asset managers with deeper insight into predictive market demand drivers. The project aimed to create a sophisticated analytics platform that could provide clear visibility into sales momentum across mutual funds and exchange-traded funds (ETFs) in the U.S.
The challenge was to translate complex datasets into actionable intelligence for decision-makers, enabling asset managers to identify opportunities, anticipate shifts in demand, and strengthen their competitive positioning in a highly dynamic market.
How we built it
Below are the headline technologies. The full stack runs deeper, with the supporting infrastructure and tooling that keeps everything fast, secure and reliable in production.
React
Powers the interactive interface analysts use to explore data.
Redux Toolkit
Keeps charts, maps and tables in sync as data updates live.
React Chart
Turns billions of dollars of data into clear, interactive visuals.
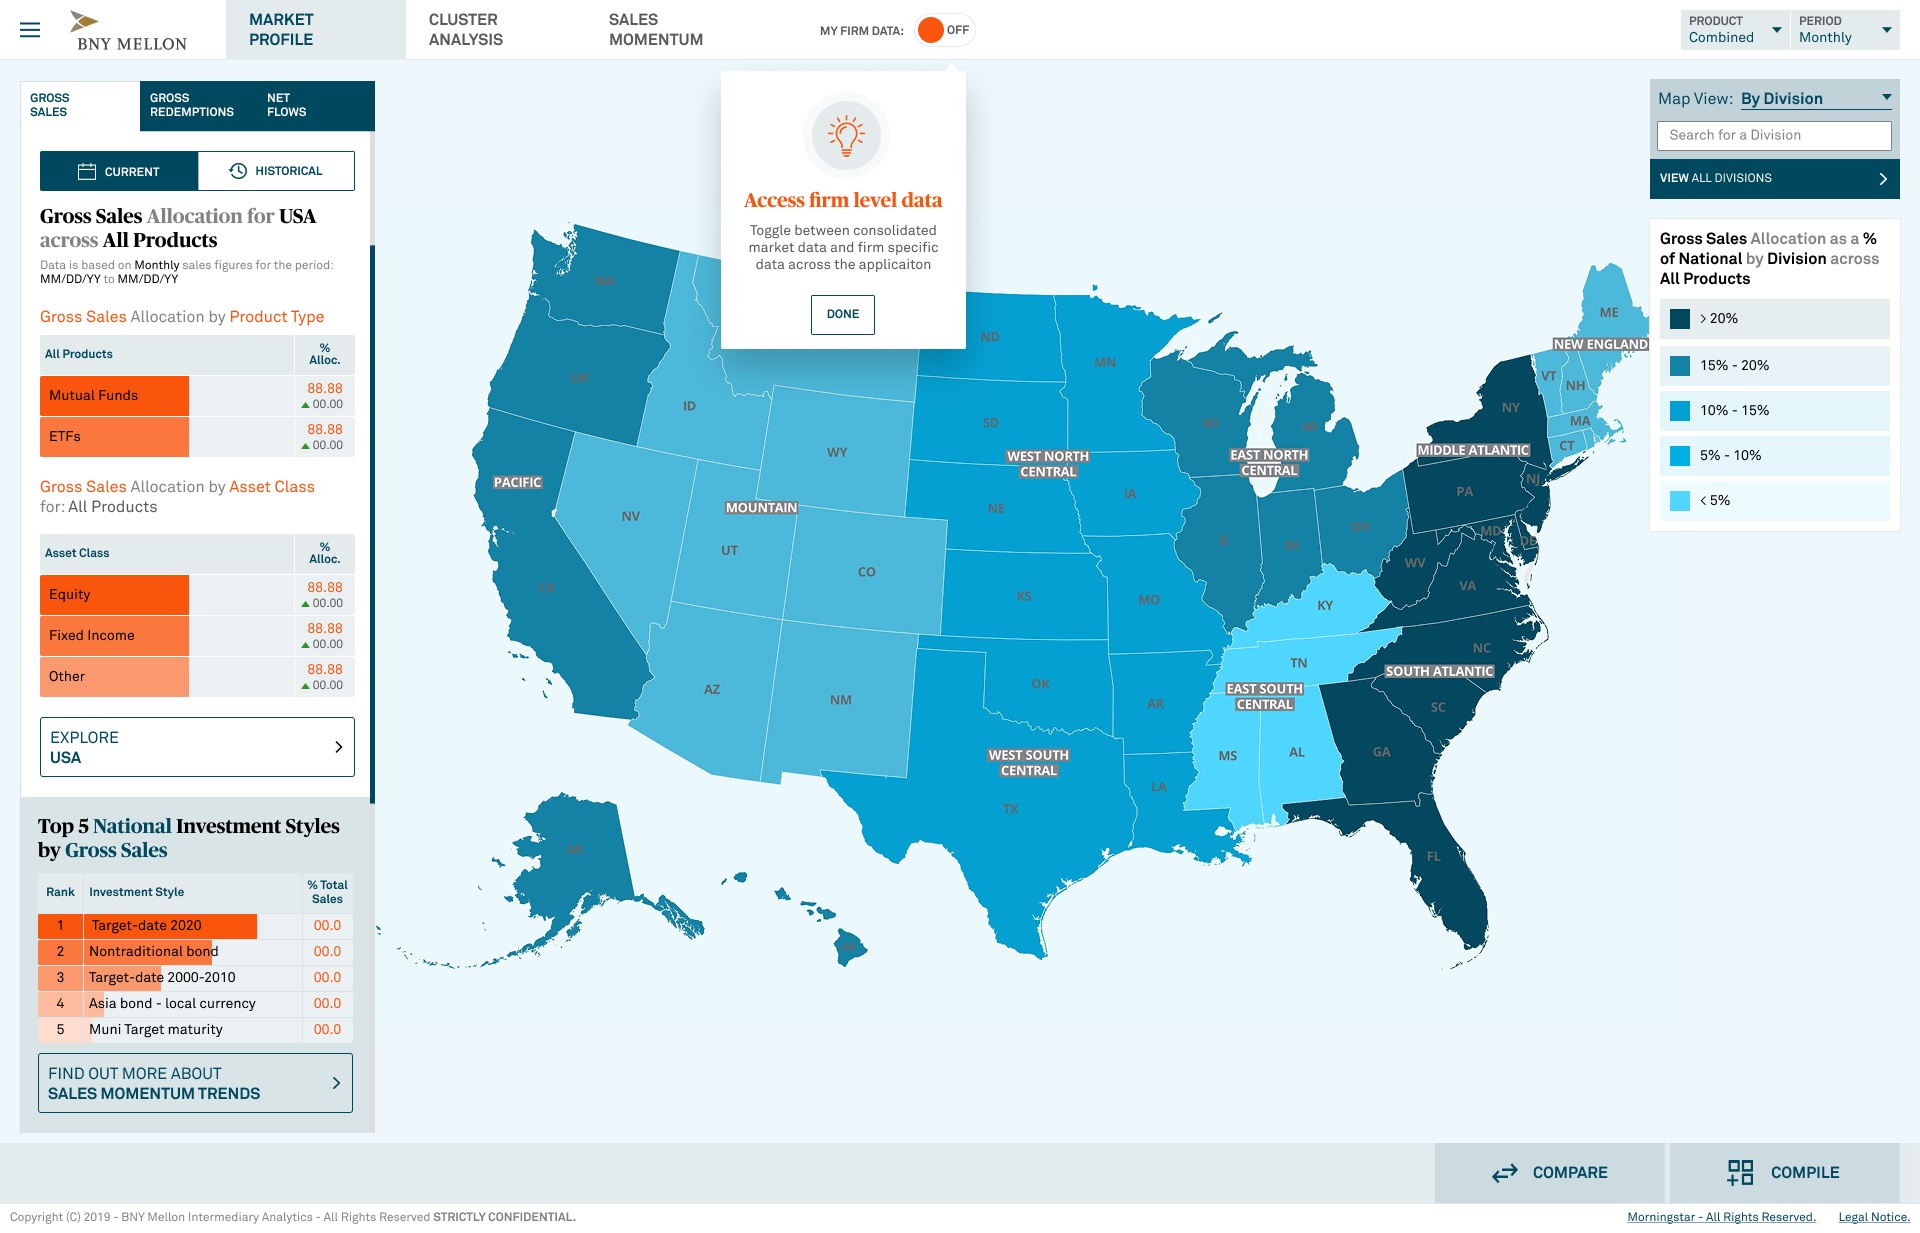
Mapbox
Maps fund performance across U.S. regions at a glance.
Emotion
Enables a clean, consistent design system across the platform.
TypeScript
Adds safety nets that catch bugs before users see them.
Outcome
The launch of the analytics platform enabled interactive segmentation of U.S. markets for mutual funds and ETFs using Mapbox, presenting billions of dollars’ worth of data in an intuitive, easy-to-understand way, with improved clarity and accessibility for asset managers.
See More Projects
See how we've transformed ideas into reality.